

Hi everyone,
First, let me start by saying that I am extremely new to the Sophos world, so this may be a silly question.
I am trying to troubleshoot an issue we are having. End users are experiencing a pretty slow web browsing experience. Much slower than usual, we have a 500/50 internet connection coming into the facility. I have checked with the ISP and they cannot find any issues on their end. SO, I have landed at our sophos device for troubleshooting.
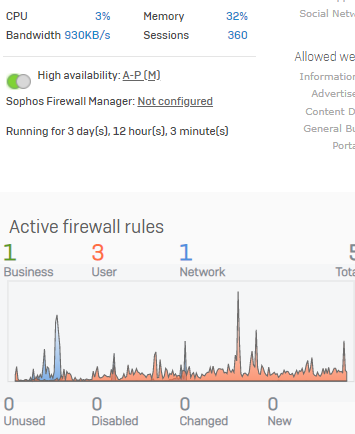
I'm thinking back before this issue started, I used to see a lot more blue on that graph than there is currently. But to be honest I don't actually know exactly what that graph is telling me. Can someone explain the graph? Another thing I noticed, is that my Bandwidth will drop extremely low at times. Can anyone point me in the right direction? This is a Sophos XG310 running 17.5.10 MR-10 running in HA mode.
Thanks!
This thread was automatically locked due to age.


