

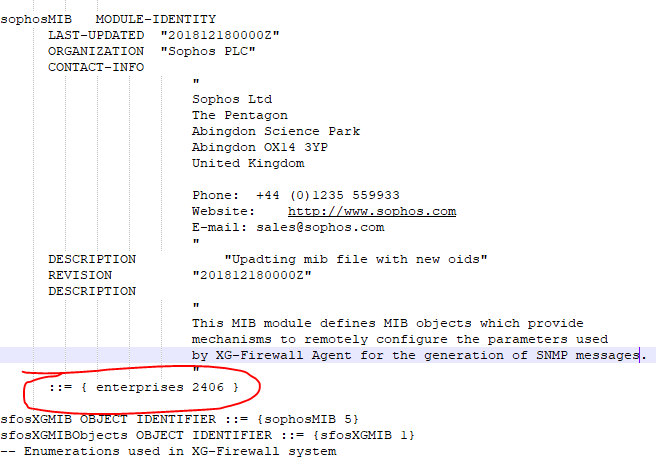
An error was found in the MIB:
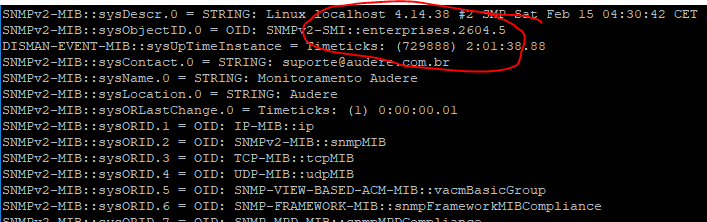
There are also many objects missing from the snmp get, even after adjusting the MIB. Returns an object not found error:

Any idea?
This thread was automatically locked due to age.
An error was found in the MIB:
There are also many objects missing from the snmp get, even after adjusting the MIB. Returns an object not found error:
Any idea?


