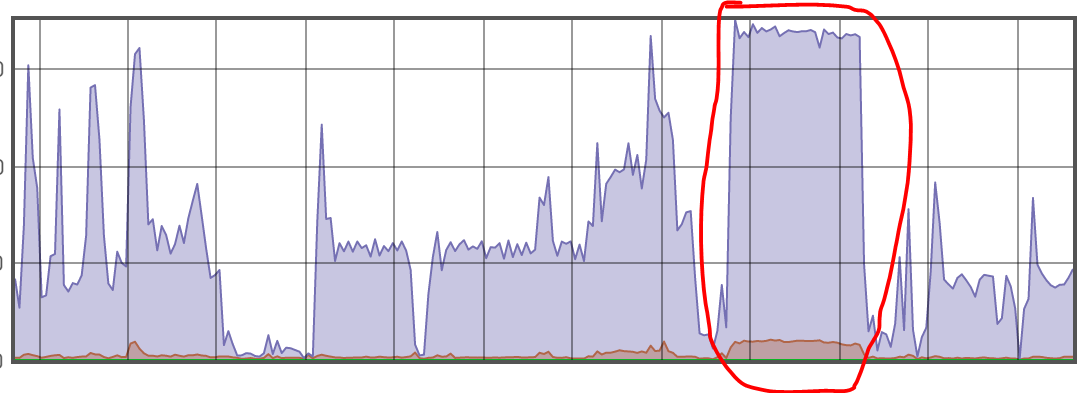
When looking at the diagnostics graphs, is there any way to determine exactly what generated a spike in traffic at a specific time?
This thread was automatically locked due to age.
Hi Tscott
Could you please confirm which parameter/component this graph represents? There is no specific way to get information about traffic, This is a graphical interpretation of traffic at a specific time.
Please refer to the article- https://community.sophos.com/kb/en-us/123186
Keyur,
the graphic should be the WAN zone. I agree with Tscott. In the reporting, there are no reports for interfaces and not drill-down reports.
For example, in UTM, you can start from WAN port, drill-down to the port being used then to the application that consumed that bandwidth.
On XG, this kind of report does not exist at all. This is one of the most important report that on XG is missing.
Keyur you should report to the team to implement this report. UTM has better reporting in the industry. No one can compete.
Thanks, everyone for the input. The image here is from one of my RED interfaces. The remote location experienced nearly complete link saturation during this time but I've been unable to determine what was using so much bandwidth. The ability to drill down into a specific time frame would be great.