This discussion has been locked.
You can no longer post new replies to this discussion. If you have a question you can start a new discussion

problem with statistics on PPPoE interface

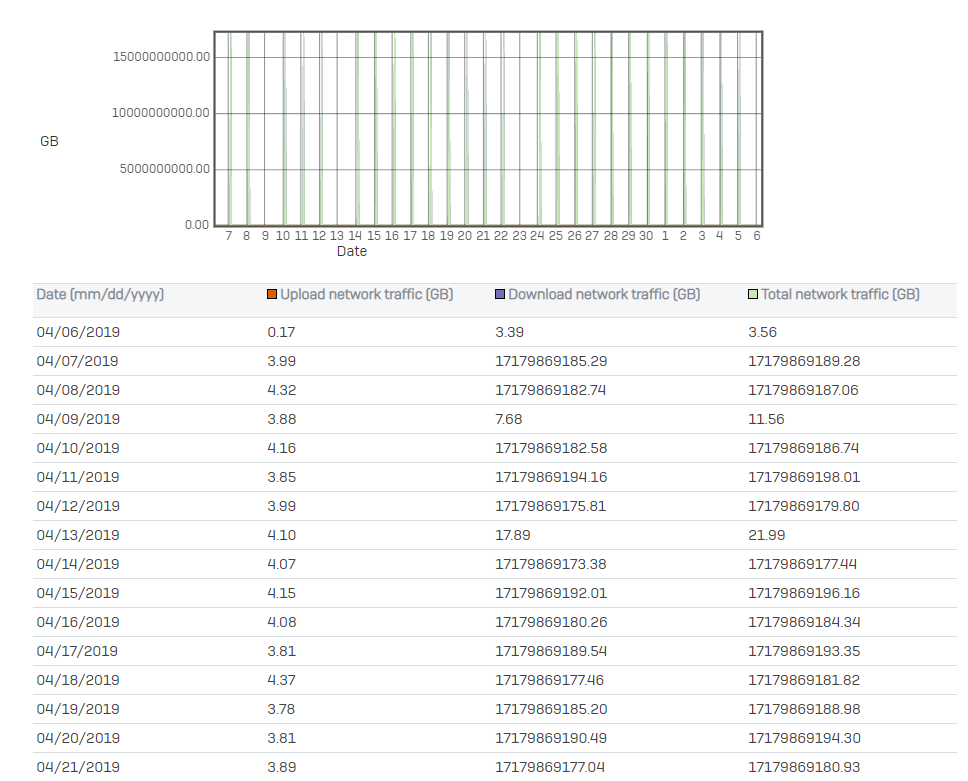
problem with statistics:


PORT TRANSFER TYPE MAX MIN AVERAGE
GuestAP ReceivedKBits 0.0 0.0 0.0
GuestAP TransmittedKBits 0.0 0.0 0.0
LAN ReceivedKBits 453.7 31.74 136.34
LAN TransmittedKBits 10431.39 1140.11 3867.63
Port1 ReceivedKBits 8.5401592760903E11 258.36 7.763781285835E10
Port1 TransmittedKBits 1530.52 14.11 413.92
Port2 ReceivedKBits 5776.92 52.22 2333.4
Port2 TransmittedKBits 426.59 17.51 118.16


on port1 I have configured PPPoE (WAN), why are there so many numbers appearing ???


This thread was automatically locked due to age.
Parents Reply Children
  • Hi Moonracker,

    What does your modem show? Check the MTU and cable connections? I have no further suggestions at this stage, I moved from ADSL to FTTC connection and the problem went away.

    Ian

  • i have Orange FTTH - don't have access to onu (gpon)

  • That makes the figures even stranger. Do you have any remote access for the XG enabled?

    Can you get the link checked to see if it is running a very high error count?

    Can you try changing the XG WAN interface to a different NIC?

    Is your FTTH 100mb/s or 1gb/s link?

    Ian

  • No any remote access.

    SFVH_SO01_SFOS 17.5.5 MR-5# ethtool -S "Port1"
    NIC statistics:
    rx_packets: 43666328
    tx_packets: 15406656
    rx_bytes: 56293404022
    tx_bytes: 2911484916
    rx_broadcast: 1367544
    tx_broadcast: 6
    rx_multicast: 0
    tx_multicast: 21
    multicast: 0
    collisions: 0
    rx_crc_errors: 0
    rx_no_buffer_count: 0
    rx_missed_errors: 0
    tx_aborted_errors: 0
    tx_carrier_errors: 0
    tx_window_errors: 0
    tx_abort_late_coll: 0
    tx_deferred_ok: 0
    tx_single_coll_ok: 0
    tx_multi_coll_ok: 0
    tx_timeout_count: 0
    rx_long_length_errors: 0
    rx_short_length_errors: 0
    rx_align_errors: 0
    tx_tcp_seg_good: 0
    tx_tcp_seg_failed: 0
    rx_flow_control_xon: 0
    rx_flow_control_xoff: 0
    tx_flow_control_xon: 0
    tx_flow_control_xoff: 0
    rx_long_byte_count: 56293404022
    tx_dma_out_of_sync: 0
    tx_smbus: 0
    rx_smbus: 0
    dropped_smbus: 0
    os2bmc_rx_by_bmc: 0
    os2bmc_tx_by_bmc: 0
    os2bmc_tx_by_host: 0
    os2bmc_rx_by_host: 0
    tx_hwtstamp_timeouts: 0
    rx_hwtstamp_cleared: 0
    rx_errors: 0
    tx_errors: 0
    tx_dropped: 0
    rx_length_errors: 0
    rx_over_errors: 0
    rx_frame_errors: 0
    rx_fifo_errors: 0
    tx_fifo_errors: 0
    tx_heartbeat_errors: 0
    tx_queue_0_packets: 15406656
    tx_queue_0_bytes: 2787492412
    tx_queue_0_restart: 0
    rx_queue_0_packets: 43666328
    rx_queue_0_bytes: 55949543574
    rx_queue_0_drops: 0
    rx_queue_0_csum_err: 0
    rx_queue_0_alloc_failed: 0


    yes, but later
    1gb/s -link (i tried : 1000FD and auto negotiations)

  • but :


    SFVH_SO01_SFOS 17.5.5 MR-5# ifconfig Port1
    Port1 Link encap:Ethernet HWaddr 00:0D:48:17:60:05
    inet6 addr: fe80::20d:48ff:fe17:6005/64 Scope:Link
    UP BROADCAST RUNNING MULTICAST MTU:1492 Metric:1
    RX packets:43690231 errors:29 dropped:1372515 overruns:0 frame:29
    TX packets:15422301 errors:0 dropped:0 overruns:0 carrier:0
    collisions:0 txqueuelen:1000
    RX bytes:55958759825 (52.1 GiB) TX bytes:2790391314 (2.5 GiB)
    Memory:fe800000-fe81ffff

    SFVH_SO01_SFOS 17.5.5 MR-5# ifconfig Port1
    Port1 Link encap:Ethernet HWaddr 00:0D:48:17:60:05
    inet6 addr: fe80::20d:48ff:fe17:6005/64 Scope:Link
    UP BROADCAST RUNNING MULTICAST MTU:1492 Metric:1
    RX packets:43690235 errors:29 dropped:1372518 overruns:0 frame:29
    TX packets:15422302 errors:0 dropped:0 overruns:0 carrier:0
    collisions:0 txqueuelen:1000
    RX bytes:55958760067 (52.1 GiB) TX bytes:2790391376 (2.5 GiB)
    Memory:fe800000-fe81ffff


    dropped counter increases ... but why ??