This discussion has been locked.
You can no longer post new replies to this discussion. If you have a question you can start a new discussion

High loads reported - cannot find cause/bug?

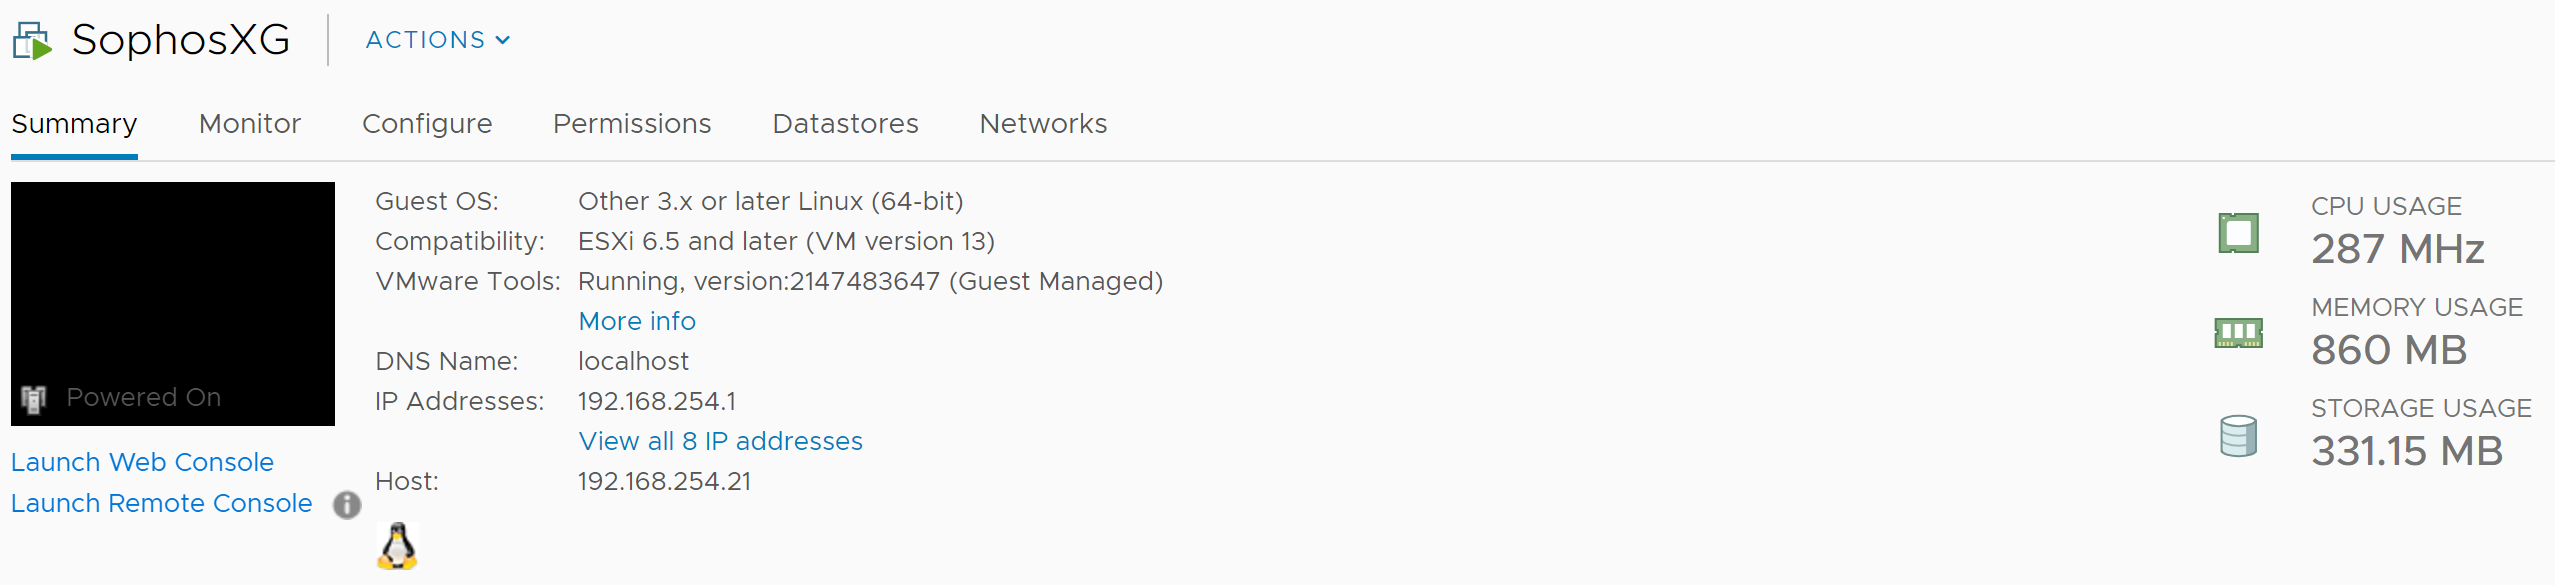
Version: 17.5GA - Home user

Virtual, ESXi 6.5.

2 vCPUs (E3-1225v3, 3.2GHz)

6GB ram assigned

Storage hosted on NFS share, backed by 8x250GB sata3 SSD drives in RAID 10.

Gigabit networking via Intel ports

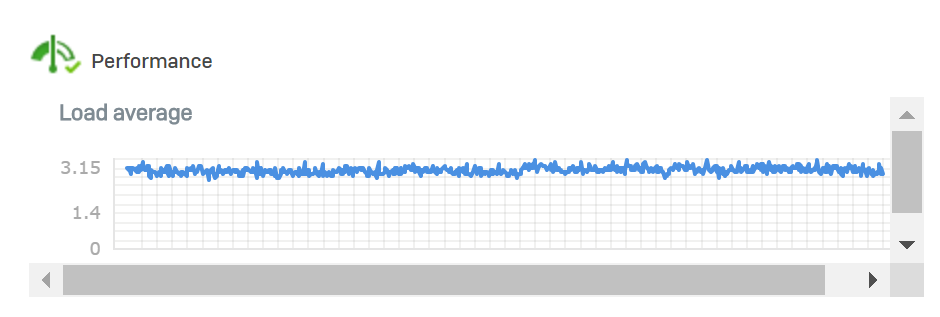
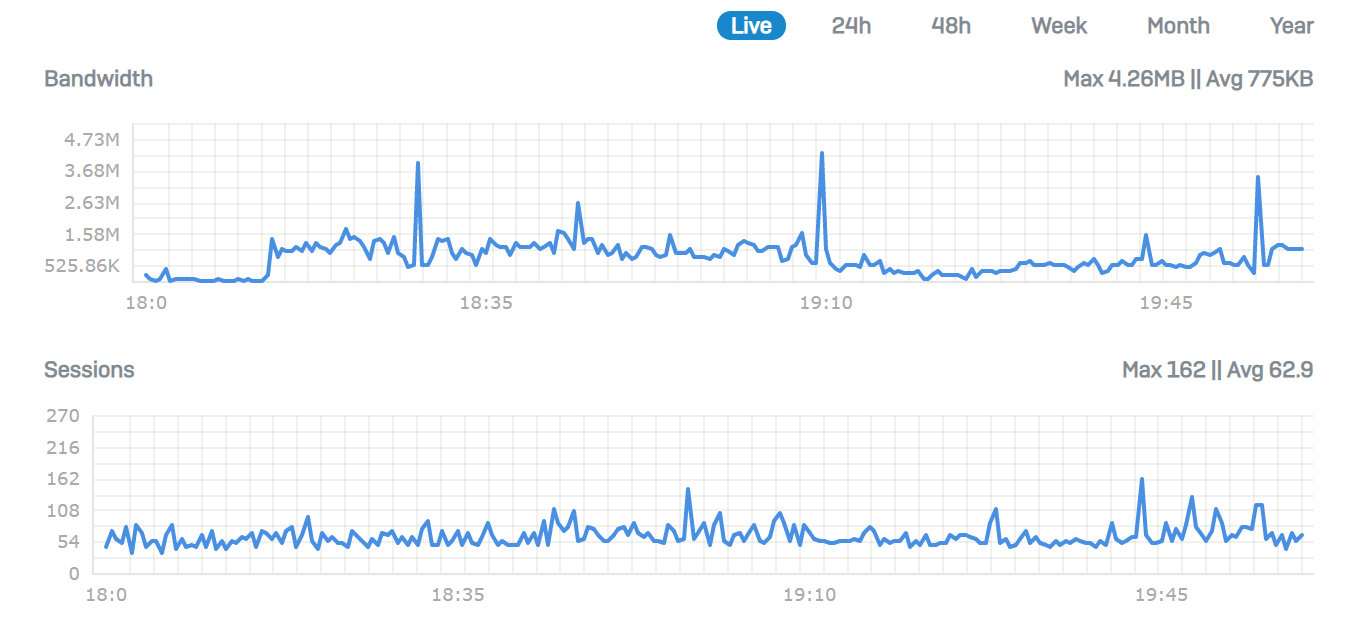
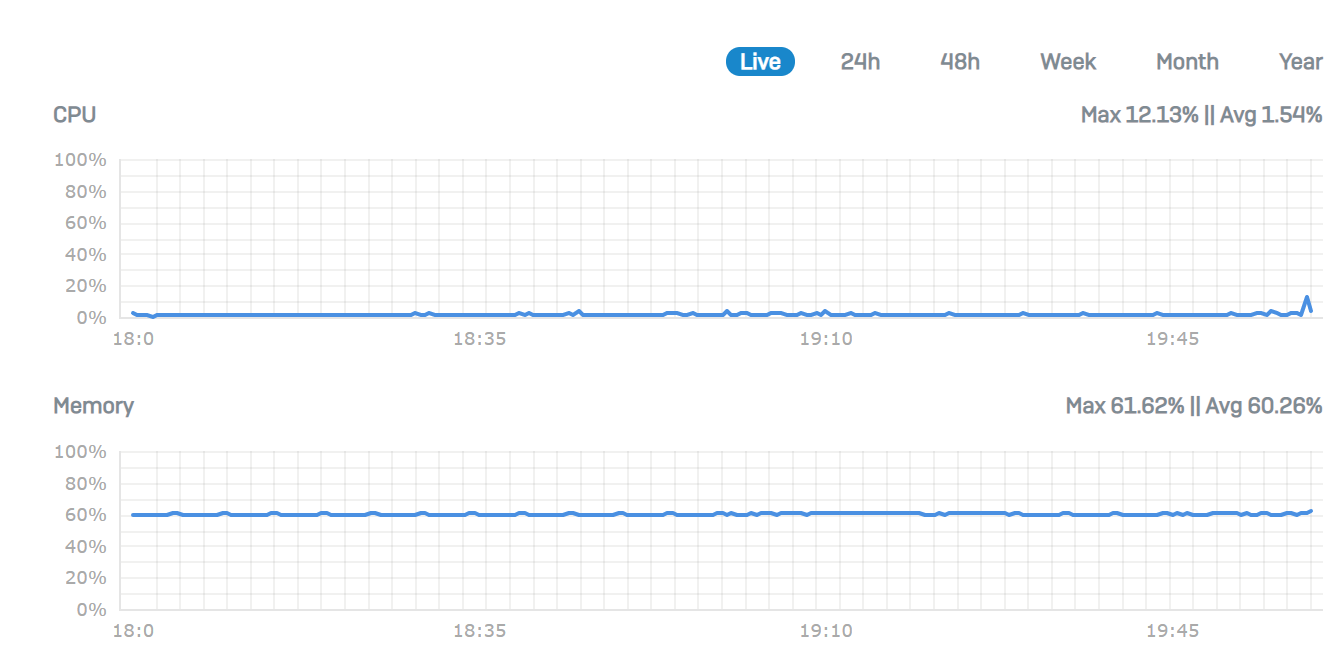
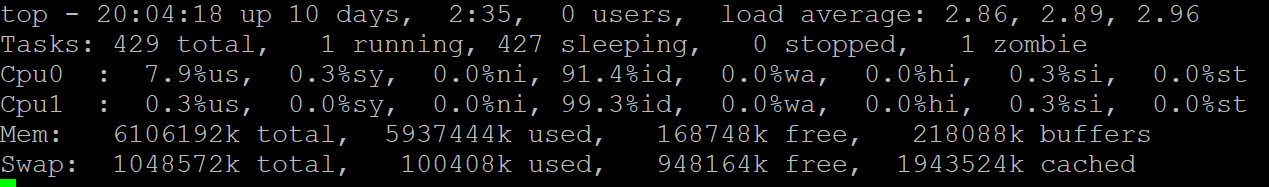
Nothing obvious going on here, but I am seeing loads around 3 on my system around the clock.  CPU low, IO low, memory fine, IO wait times low, CPU READY fine.  Does not seem to matter what kind of load is on the server (same during day, night, work/school, whatever).


vmstat doesn't show anything either:


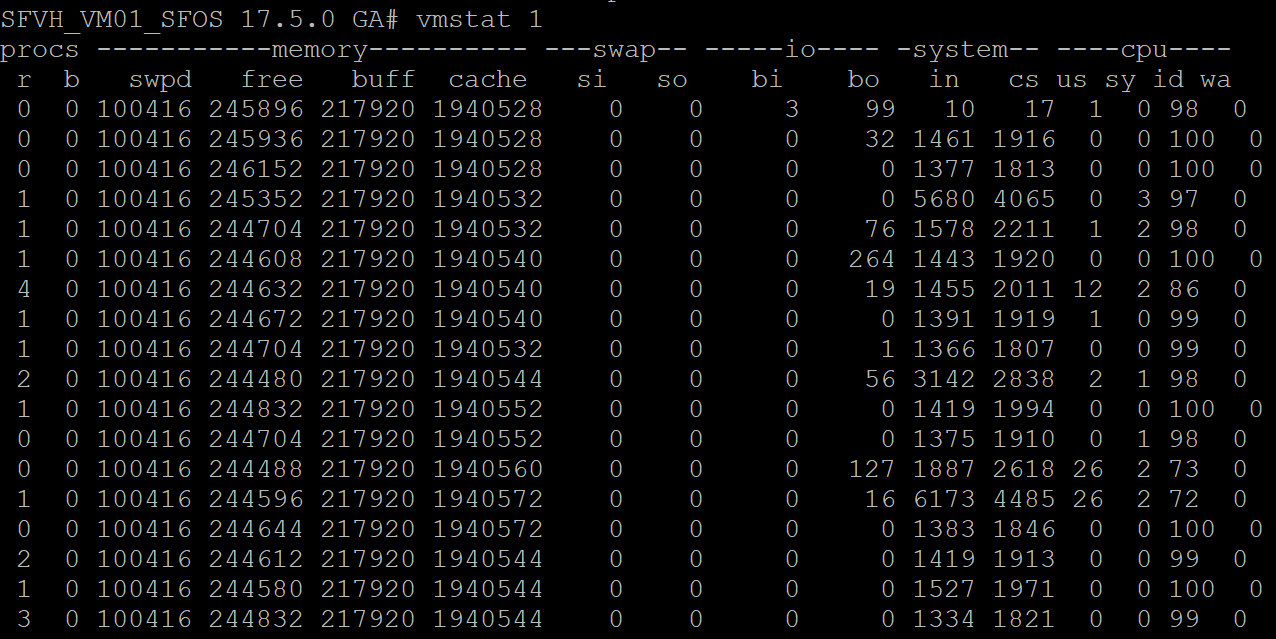
It seems like it must be a bug, but who knows.

I have tried to upgrade to 4vcpus, no change.  Performance seems perfectly fine, the only indicated of any real load is the graph (and top on the system), but nothing symptomatic.

Top:


Any thoughts?  Anyone else seeing the same?


This thread was automatically locked due to age.
Parents
  • Hi,

    performance load of 3 means you have number of background tasks running which are using a reasonable amount of cpu time. You need at least 1 more cpu than the load indicates to give you some bedroom. Now if you use console and run the top process (in detail) that will show what is the cause within XG, not the VM.

    Things to look at are the NIC cards on the VM to ensure they are not going into power saving mode. Have you assigned dedicated memory, not shared? How many other systems are sharing the VM, CPU,  RAM etc.

    Ian

  • Thanks, I am very familiar with what load says, but there is no real CPU usage.  All of the stats I included were from the within the VM itself, not the hypervisor.  Tell me where you see the CPU usage :).  There are other VMs on the box, but they are all similarly low usage and NONE of them are reporting load issues (of any sort).


    Here is the load for the UTM it replaced for the last year:

    Aside from the errors on the left end, it has been minimal.  If anything, it had a more complex ruleset than the XG does.

  • Hi,

    did you check to ensure you have the memory set at static/fixed for the XG? Previous cases similar to yours had dynamic memory configured.

    Ian

  • Sorry, I forgot to address that.  I do not have the memory reserved.  I will test that, though I've myself not seen that affect load unless the host itself was running low.  I've got about 8GB free on the host right now, so it would surprise me. I think, in the meantime, I will stop services to see if I can isolate what might be causing it...but it sure isn't showing up in any stats I can check.

  • IPS seemed to have the biggest impact on load.  Disabled it and load dropped below 2.  Enabled it, back up to 3.  Doesn't matter how many (or if any - i disabled all IPS policies on rules) policies are enabled in rules.  Watching snort, I don't see anything on it that should be causing issue.  Again, previous UTM, running snort (though older version) did not exhibit this behavior.  In all other measures, XG seems far more efficient for system resources.  Doesn't make sense to me.

Reply
  • IPS seemed to have the biggest impact on load.  Disabled it and load dropped below 2.  Enabled it, back up to 3.  Doesn't matter how many (or if any - i disabled all IPS policies on rules) policies are enabled in rules.  Watching snort, I don't see anything on it that should be causing issue.  Again, previous UTM, running snort (though older version) did not exhibit this behavior.  In all other measures, XG seems far more efficient for system resources.  Doesn't make sense to me.

Children
No Data