This discussion has been locked.
You can no longer post new replies to this discussion. If you have a question you can start a new discussion

Real Bandwidth usage - Control Center which one is correct?

Hi All,

After years of XG usage, I still cannot understand in the CC which graph is the correct one. I only have one user role and look at the graphs that CC reports:

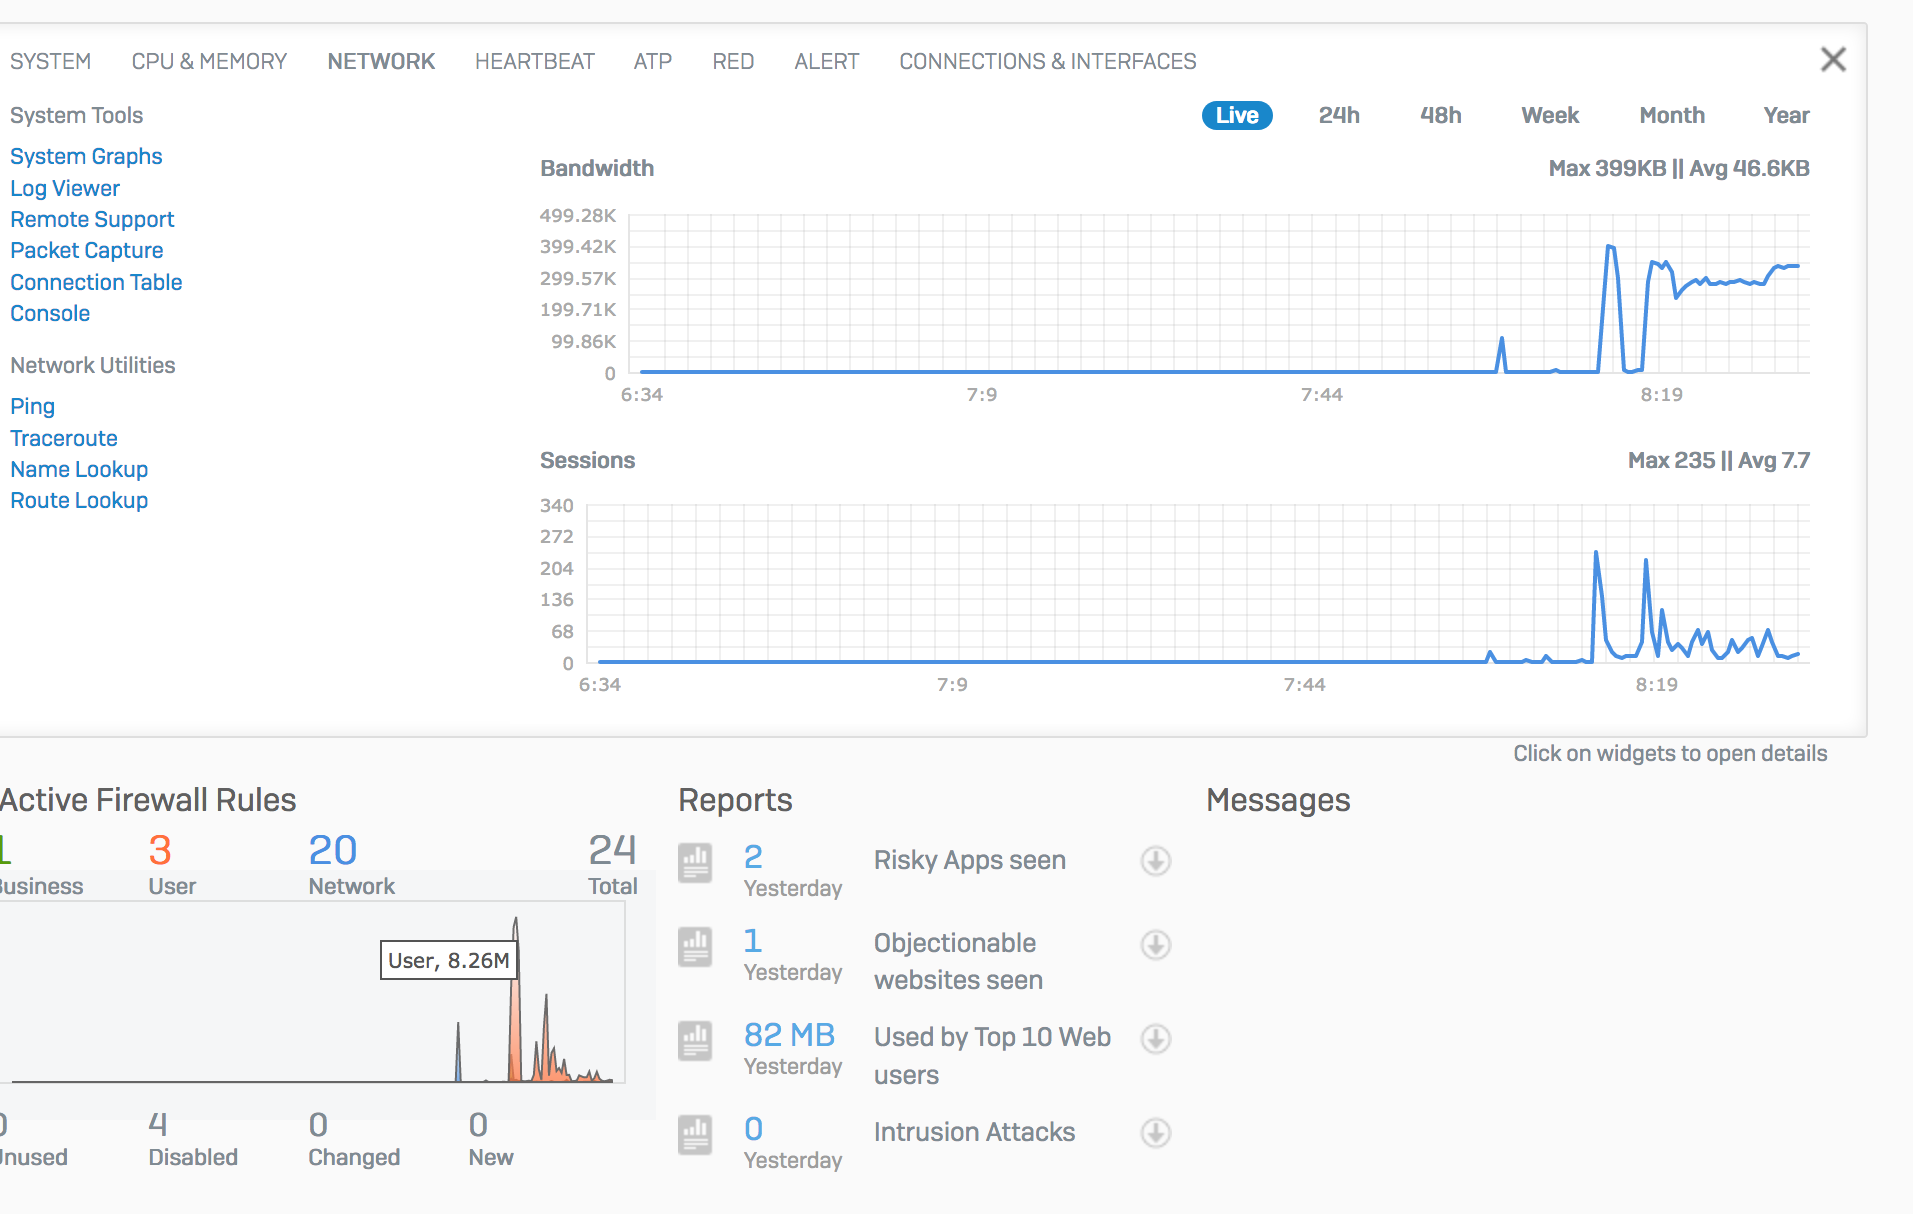
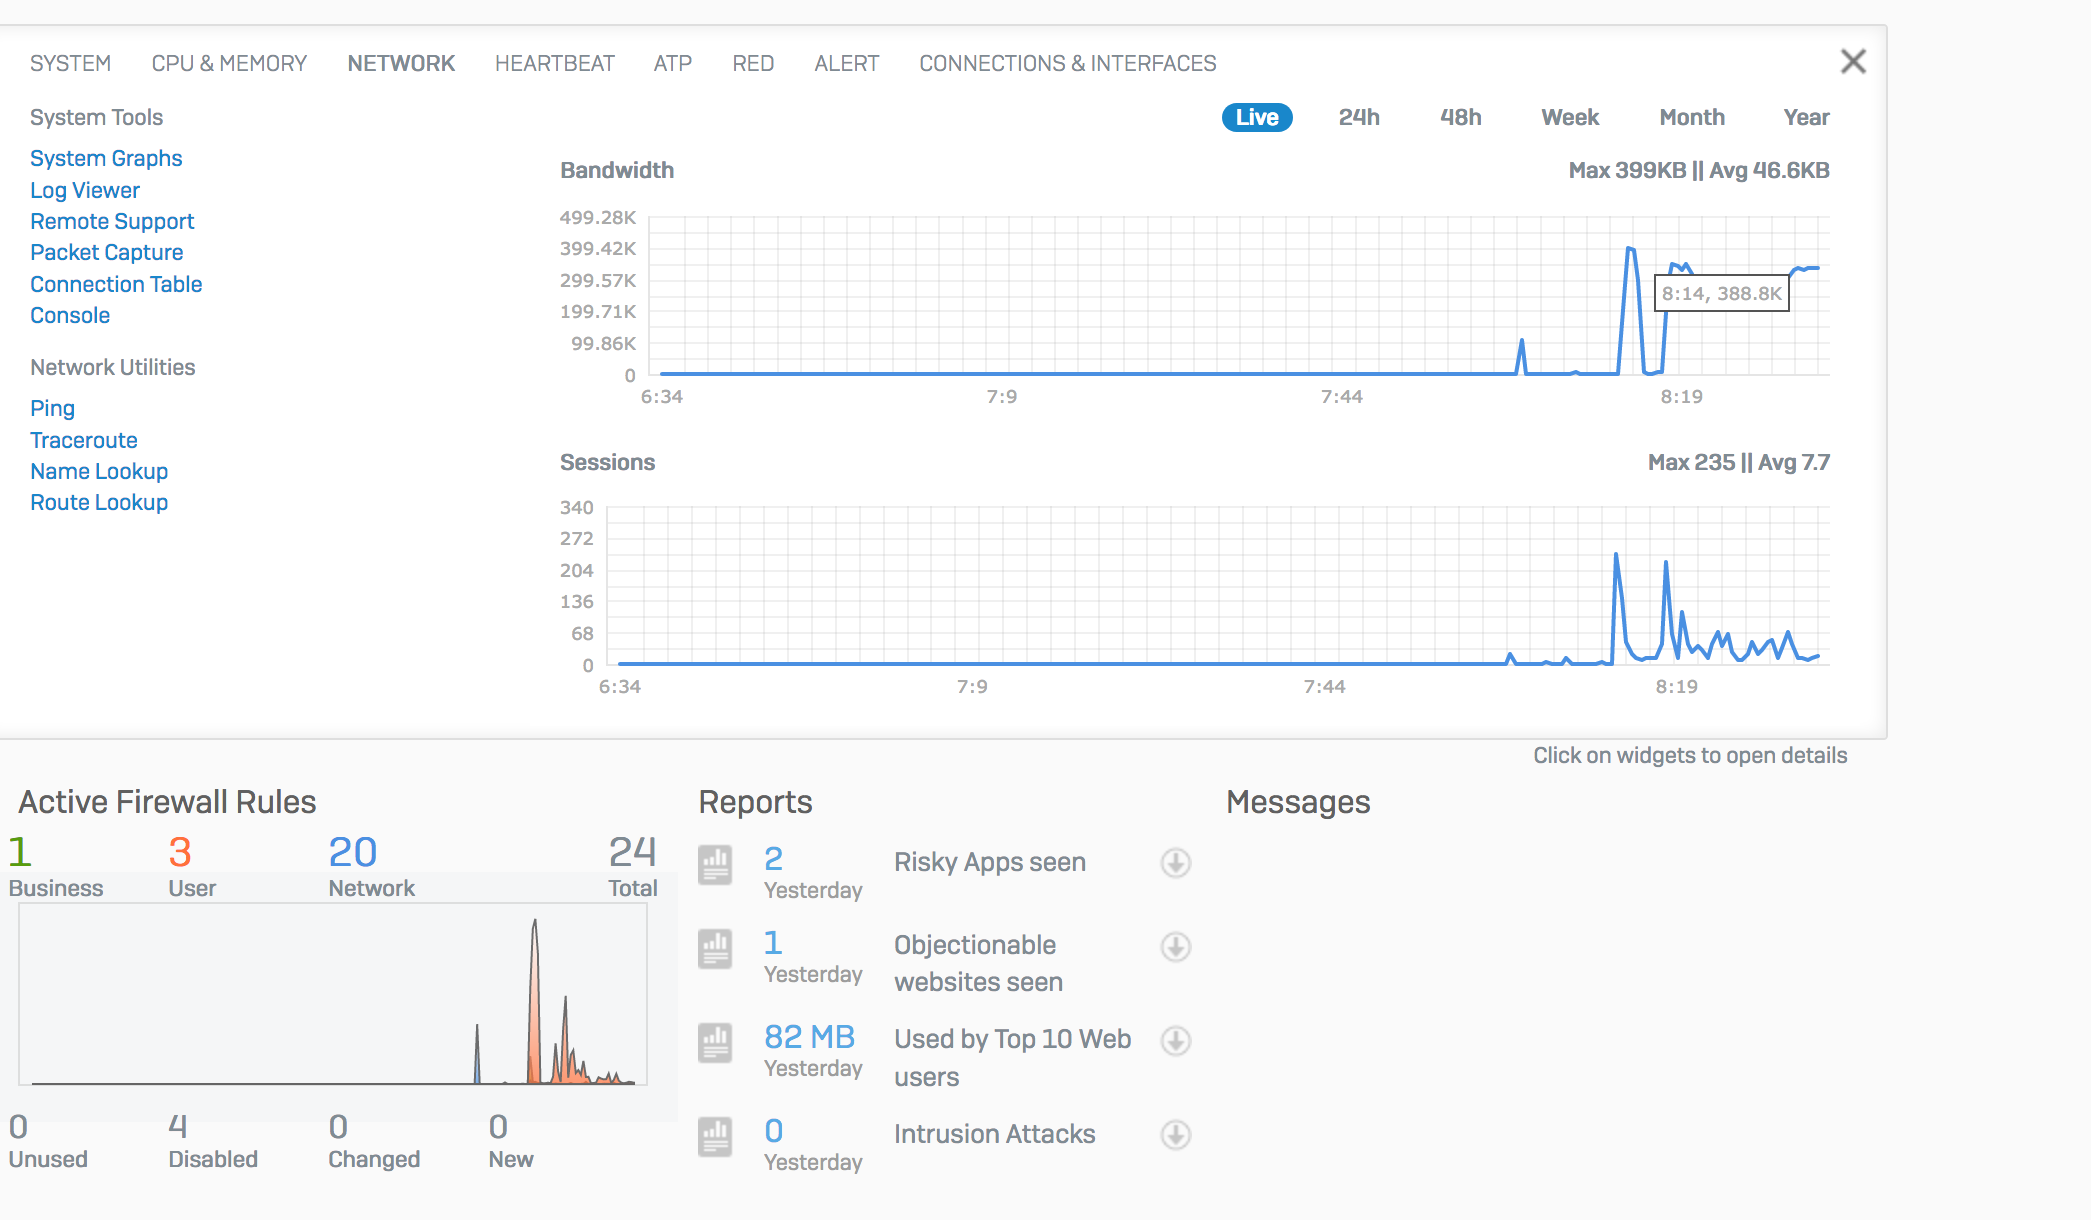
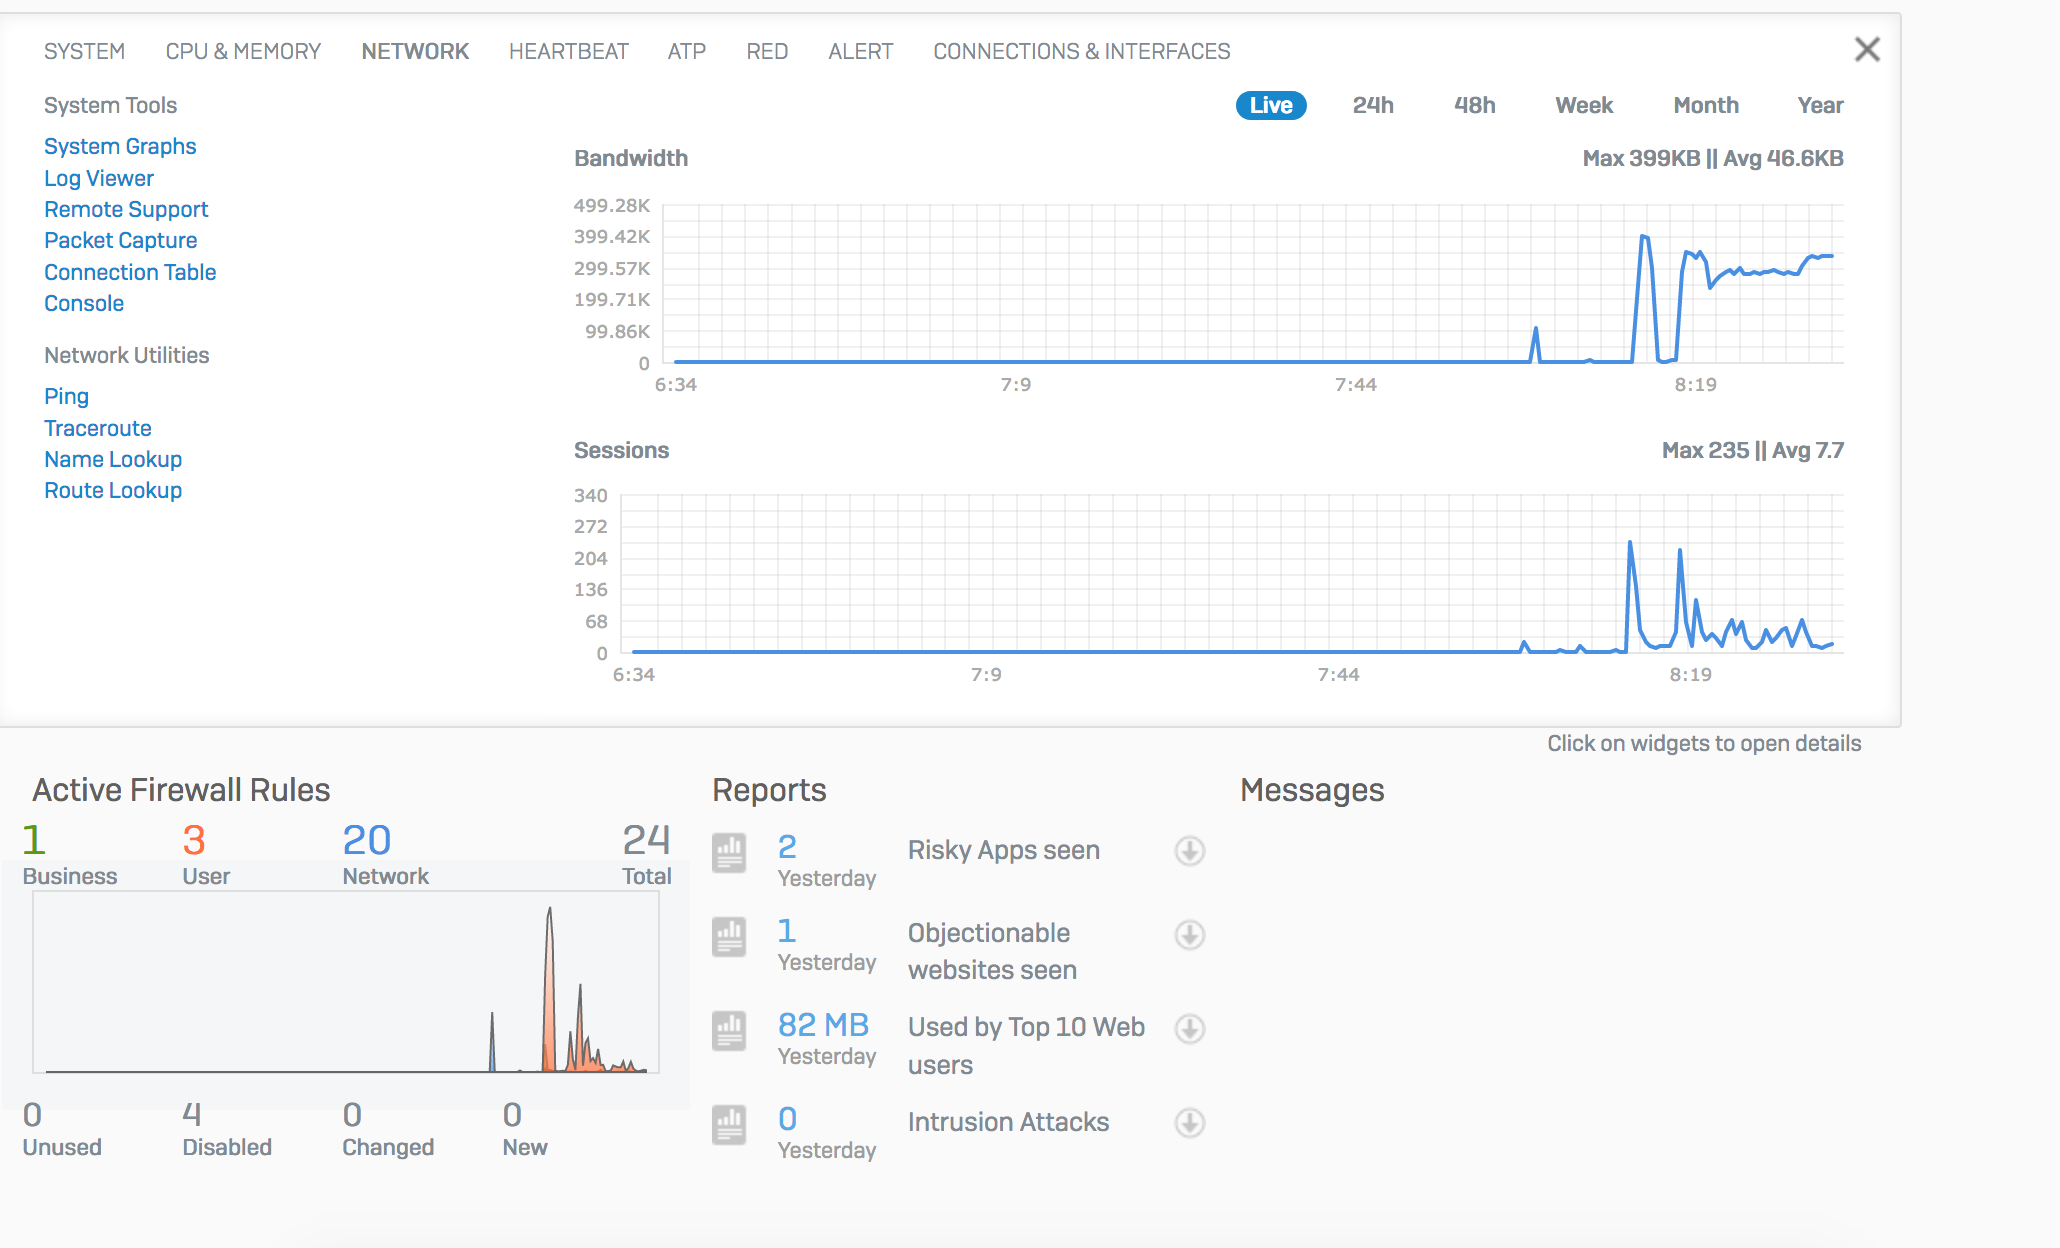
Looking at the command line output:

system diagnostics utilities bandwidth-monitor

it reports like "bandwidth graph". I have a 100Mb at home and I never reach more than 8 Mb behind XG. Yes I know about IPS, Web Proxy and Anti-malware scanning but graphs are not reporting correct information at all. This is the feeling I have.

What about other guys on Community?

Regards


This thread was automatically locked due to age.
Parents
  • HI Luk,

    like you those graphs always puzzled me, the one on rule count shows 15 to 20mb/s download, I only have a 4.5mb/s link.

    If you want some extra strange graphs click on the little icon in the WAN link management next to each WAN connection. Now one of my links has IPv4 and IPv6 and funnily the graph shows the same amount of data on both.

    Ian

Reply
  • HI Luk,

    like you those graphs always puzzled me, the one on rule count shows 15 to 20mb/s download, I only have a 4.5mb/s link.

    If you want some extra strange graphs click on the little icon in the WAN link management next to each WAN connection. Now one of my links has IPv4 and IPv6 and funnily the graph shows the same amount of data on both.

    Ian

Children