Guest User!

You are not Sophos Staff.

This discussion has been locked.
You can no longer post new replies to this discussion. If you have a question you can start a new discussion

Problem with webserver output

Good afternoon,

we are currently rolling out Sophos Endpoint Protection and Intercept X with Sophos Central.

Our production has a web testing application that writes lines in an output window on an html side downloaded from the testing computer (Rasberry Pi). The output comes from some kind of json application that is run on the testing computer.  After installing Sophos Endpoint Protection the output does not come line by line as the test proceeds but instead of this it is output at the end of all tests - which is ab big problem. I assume that it is delayed because sophos waits until the connection with the output stream is closed instead of writing line by line.


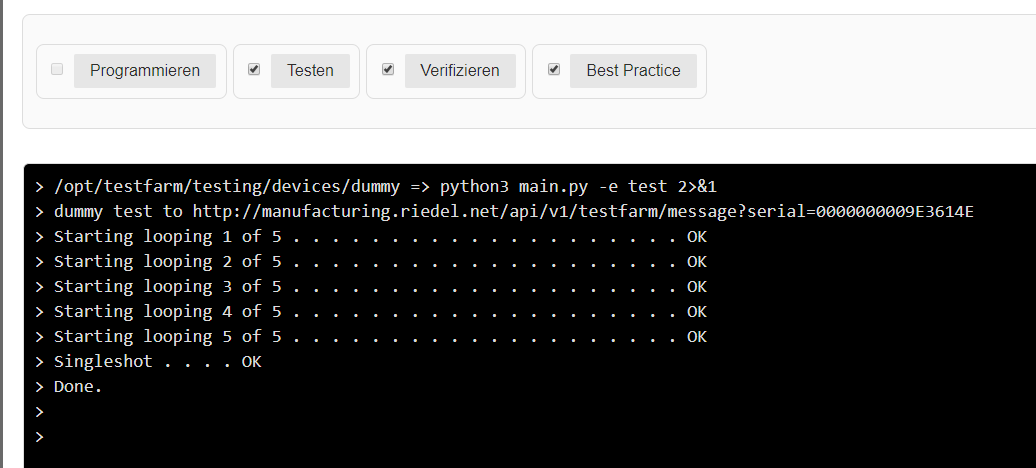
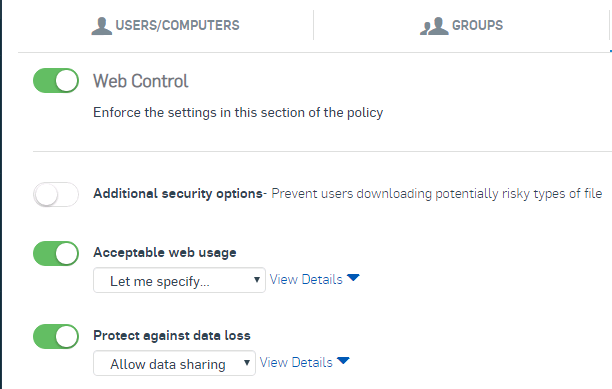
I was able to prevent this from happening by switching off Threat Protection and Web Control with the admin password. However this is too much and the handling is not possible in production. I tried do this with greater granulatity and a copied policiy for special computers but this was not working.

At first it looked like this was working

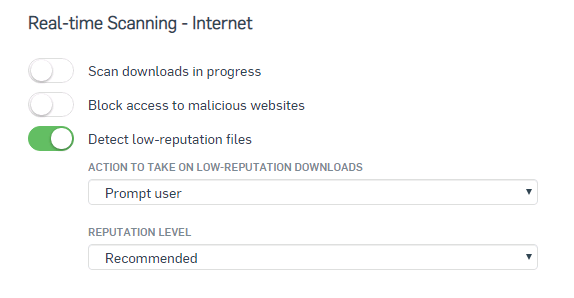
But it did not. Then I added the following:


Related to this I have some questions:

1) How can this be debbuged in a good way? Nothing can be seen in the events of the computer at the Central Console.

2) How can I verify that the setting is actually pushed to the client. I usually do an update at "Infomation - Update Now".

3) When disabling the policy by entering the password I was able to switch of the modules on a high level but I was not able to switch it on again. What is the reason for this?

4) Are there completely other approaches to prevent this behavior? We never had issues like this with our old virusscanner F-Secure.

Best regards,
Bernd


This thread was automatically locked due to age.
  • Hi  

    I can understand your concern regarding the issue with your environment. I'd like to know that your production system is a server or a client system and also where you have disabled web control and threat protection. On which particular system, the web application runs? 

    Answer to your question:

    1) How can this be debugged in a good way? Nothing can be seen in the events of the computer at the Central Console. - Debug logging can be enabled for any of the components when it is necessary. Before that, you need to find out the exact component which is causing the issue like web control or threat protection. Scanning results are normally available in SAV.txt under the path "C:/programdata/Sophos/Sophos Anti-Virus.

    2) How can I verify that the setting is actually pushed to the client? I usually do an update at "Infomation - Update Now". - To verify the policy, one simple way is to go to Sophos client. Click on "about" in the right side bottom and then click on diagnostic tools. Once it is opened, please click on the policy in the tools wizard. There you'll find the time when the last policy received for each and every policy.

    3) When disabling the policy by entering the password I was able to switch off the modules on a high level but I was not able to switch it on again. What is the reason for this? - It is by design. Once you put the tamper password and disable the tamper, you can do any of the changes and once it is done, you can force an update on the client. It will automatically enable the tamper protection on the machine.

    4) Are there completely other approaches to prevent this behaviour? We never had issues like this with our old virusscanner F-Secure. - Two anti-viruses might have different architecture and design, so on their expected work might differ. 

    Regards,

    Jasmin
    Community Support Engineer | Sophos Support

    Sophos Support VideosKnowledge Base  |  @SophosSupport | Sign up for SMS Alerts |
    If a post solves your question use the 'This helped me' link

  • Hello Jasmin,

    thank you for your answer.

    The production system ist a Raspberry Pi which has no antivirus software at all. So everything is happening in the webbrowser of the client.


    To 1) You are writing debug logging can be enabled. How?

    The problem I see is that nothing is really blocked. Only the output is delayed. Probably until the stream or connection is closed. So this must be some very special protection mechanism. Insiders probably know what is happening.

    To 4) I was thinking about a complete different approach. Maybe exluding some network range completely. It can not be done on the application level as exluding IE, Chrome and Firefox wouldn't be a good idea.

    Best regards,
    Bernd

  • Hi  

    So, it should probably be happening because of Web protection or web control as you just said client is accessing the application through the browser. 

    We generally advise customers to enable debug logs only when the problem is causing only because of web control. I'd suggest you to just disable web control policy on one machine and check output is normal or not. I'll provide you with the steps in the PM if needed as it takes a lot of space on the client machine once they are enabled.

    Apart from that, I'd like to know the way you are accessing your web server through the browser (IP or website address). Also, are web servers just internal?

    Regards,

    Jasmin
    Community Support Engineer | Sophos Support

    Sophos Support VideosKnowledge Base  |  @SophosSupport | Sign up for SMS Alerts |
    If a post solves your question use the 'This helped me' link