Guest User!

You are not Sophos Staff.

This discussion has been locked.
You can no longer post new replies to this discussion. If you have a question you can start a new discussion

UTM Performance Crashes with A/V Scanning, but CPU only at 12%

I'm having an issue with Sophos UTM 9.307 that when it performs A/V scanning on large file (300 MB) downloads, my entire network comes to a screeching halt, with several machines dropping network connection or freezing up.  BTW, I'm using the dual A/V scan.

My UTM installation is on a home-built machine using an Intel i7-4790k CPU @ 4.0 GHz, hyperthreaded with 8 cores, 8 GB RAM and a 60 GB SSD, Z97 chipset.  NIC's are a single Intel i-350, 4 port (only 2 used - one WAN, one LAN) and an Intel NIC built onto the motherboard.  I wouldn't think I'd be potentially hardware limited with this setup.

Per posts here on the Sophos BBS, I've disabled Intel's "Enhanced SpeedStep" and "Turbo Boost" options in BIOS, along with the enhanced "C states".  I've also performed BarryG's recommendation at the console:

echo "performance" >/sys/devices/system/cpu/cpuN/cpufreq/scaling_governor

for each logical CPU 0-7.

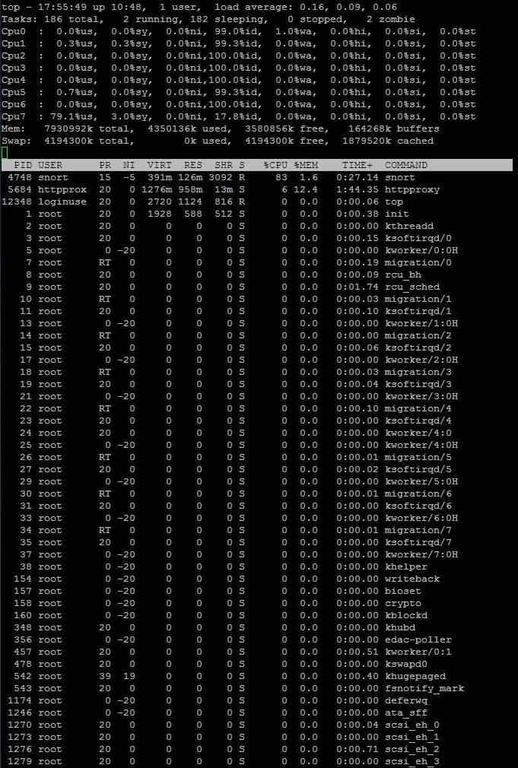
The maximum CPU usage I've ever recorded in Sophos UTM during normal operation is around 12% when performing a scan on a single 300 MB download.  Note that this 12% corresponds to about 100% loading of one logical CPU core.  I was able to get around 17% CPU usage once when I tried the same download and scan operations on 2 machines (real machines, not VM's) simultaneously, but that completely locked up the network and I only had a few other machines running.  When not performing A/V scanning, my CPU hovers around 1-2%, since we don't have that much network traffic right now.

It seems like the UTM isn't taking full advantage of all the CPU horsepower that is available.  I could understand one of the connections / scans being tied to a logical CPU (with SNORT, etc) and locking it up, but it seems like the UTM would transfer other connections to other logical CPU's and not lock up the entire network.

BTW, the dual A/V scan of the 300 MB file took a couple of minutes.  Does this sound reasonable given the hardware?

It's almost as if the UTM is only using one of the available 8 logical cores to do almost all of the work in my system.

I'm aware that hyperthreading could be an issue due to the way the OS assigns the logical cores, such that logical core 0 and 1 are essentially the same physical core.  I could see this as being a problem when core 0 is at 100% load and the OS tries to give work to the next logical core (1 in this case), which is really already at 100%, but I thought that the underlying OS was "smart" enough to realize this.

Should I disable hyperthreading?  If so, will this corrupt my current Sophos UTM installation that expects to see 8 CPU's?

Does anyone have any other suggestions on setting, etc that would enable the full potential of this hardware setup or is this "normal" / to be expected?  

Thanks in advance,

- Ben


This thread was automatically locked due to age.
  • When I disable CPU HT and the motherboard's NIC when I do the re-install, obviously the CPU and ethernet interface numbering will change (decrease) from what I currently have.

    For the currently installed NIC's, they're numbered eth0 - eth4 (5 total, with 4 on the i350 card and 1 on the MB).  Oddly enough, the motherboard NIC was assigned eth2 by the UTM installation.  Current configuration has eth0 as LAN (internal) and eth4 as WAN (external).

    I'd prefer to do a restore of my UTM current configuration after the re-install, instead of having to create all my rules, etc again from scratch.  Will the CPU and NIC numbering change cause issues with doing a "restore"?

    My thought was to move the WAN to interface eth3 prior to the reinstall and during the re-install process make eth3 the WAN interface.  That way after I do the re-install and restore my current configuration, all I should have to do is physically move the WAN cable from my current eth3 port to the "new, after re-install" eth3 port.  Should this work?

    Thanks,

    - Ben
  • why disable the onboard nic?  unless it's a realtek or something like that.
  • why disable the onboard nic?  unless it's a realtek or something like that.


    Every time I've tried to enable it and put the NVR on it, it's crashed the system.  This could very easily be something that I'm doing incorrectly in the configuration, but since I'm not really using this NIC right now, I'm taking your advice and disabling everything on the MB that isn't absolutely necessary.  This should reduce the potential for conflicts and may possibly save a little energy as well.  In other words, it can't hurt [:)]

    I can still put the NVR on one of the i350's 4 ports and take full advantage of this card's "on board" processing or just VLAN it on my CISCO switch.

    Thanks,

    -Ben
  • Hi,

    1. The system should not have a problem booting with the CPU count changed. Can you take a picture of the errors?

    2. you can capture screenshots if using an SSH connection

    3. if you don't have the NIC assigned in the UTM, creating a backup, and restoring it to a new install without that NIC should work.

    4. the 100% CPU on the http proxy sounds like that's your bottleneck. 
    I don't know how well threaded the proxy is; if it's not, then that could explain why you're having trouble with other (http/s) traffic not passing.

    Barry

    the http proxy will grab ALL cpu threads available that it can.  I've tested this with 2,4,8 cpu cores..[:)]
    we'll wait for the rest of the requested information.
  • the http proxy will grab ALL cpu threads available that it can.  I've tested this with 2,4,8 cpu cores..[:)]
    we'll wait for the rest of the requested information.


    OK... any idea why he's seeing 100% utilization on one core only? not enough traffic?

    Barry
  • Barry,

    I'll try to take a photo of the screen errors and "top" output when I get home this evening.  I'm not using SSH; just a monitor hooked up to the VGA port on the motherboards, so I'll have to do it the old fashioned way [;)]

    Before, when I used the "top" command, I didn't add any additional parameters.  Are there any additional command parameters that I should use?

    For what it's worth, this morning before I left the house, I did a quick test where I set the max CPU frequency to 800 MHz for all 8 cores in BIOS and did a quick speed test using OOKLA.  The max download speed was around 36 Mbps, whereas I normally get about 85 Mbps.  Overall CPU usage (all 8 cores) was pegged at 13%.  It appeared that I was hitting the limit of a single core.  After throttling all cores back to 4.0 GHz in BIOS, the download speed went back to 85, where it belongs.

    It seems that for whatever reason, I am only getting one core of my CPU to engage.

    Any thoughts?

    If you have list of things you'd like me to try, let me know and I'll give 'em a shot.  I should have some time tomorrow morning to tinker with the system.

    Thanks,

    - Ben
  • top: no paramaters needed, but you can hit '1' while in top to show/hide all the CPUs / HTs

    I agree that you seem to be getting a single-core bottleneck, but I'm not sure why.
    You could try having several devices download at once.

    It's conceivable that the A/V scanners have some locking, but I'm just guessing.

    Barry
  • OK... any idea why he's seeing 100% utilization on one core only? not enough traffic?

    Barry


    something could be hogging the other cpu...a top screenie will go a long way here.
  • Attached are the screen captures from "top".  All 8 logical cores were active (HT enabled) and set at 4.0 GHz in BIOS.

    The first photo, "Capture01", was taken just as I began the download of the ~295 MB NVIDIA graphics driver, so this is basically what's happening during the download phase.

    The other 3 screen captures are from when the actual A/V scanning was occurring.  Note that all four of these screen captures were from the same download and A/V scan.

    I know this is somewhat academic, since in the future I'll limit A/V scans to 10MB or less, but I think these results are interesting, nonetheless.  Previously, I was unaware of the "1" toggle for "top", so disregard my earlier comment on only 1 core taking the entire load.  1 core does still take the vast majority of the load the vast majority of the time, but which core and the actual percentage does change somewhat.

    I probably won't get a chance to capture the error message with HT turned off until tomorrow, but I'll post it when I do.

    Any ideas, advice or suggestions will be greatly appreciated.

    Thanks in advance,

    - Ben