This discussion has been locked.
You can no longer post new replies to this discussion. If you have a question you can start a new discussion

Webproxy generates a lot of traffic

Sophos UTM 9.103-5

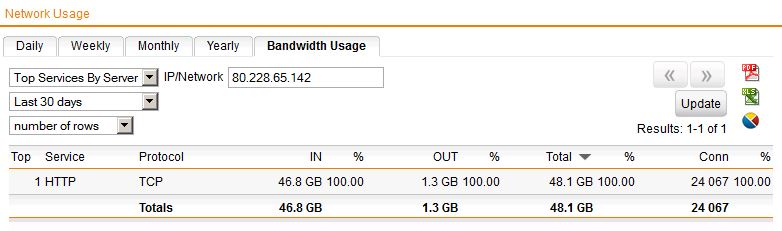
Web Protection -> Web Filtering generates permanent traffic, always using nearly 100% of the WAN line. 
If you set the "Filtering Status" to disabled, traffic stopps immediately.

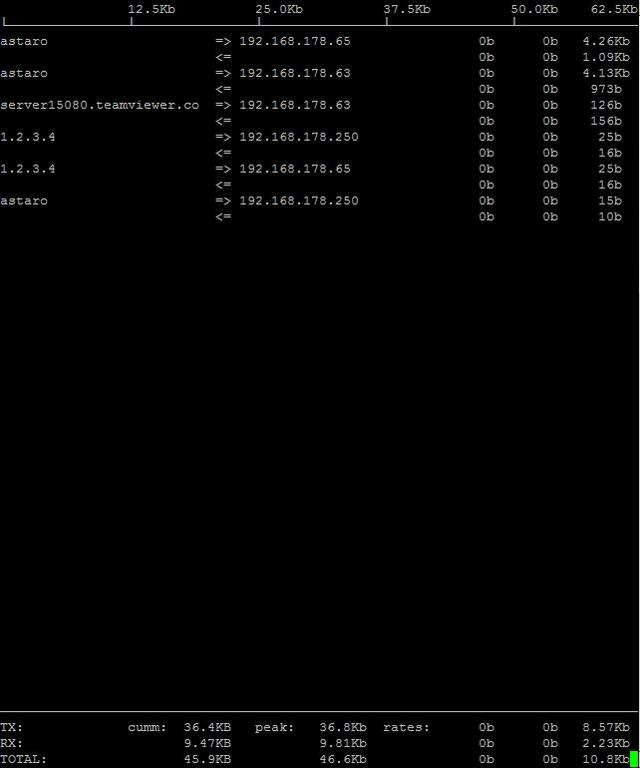
Flow COntrol shows this:
1 ewe-ol-GGC-Node1-host5-158.cache.google.com tcp/443 65 KB/s 1 MB
2 ewe-ol-GGC-Node1-142.cache.google.com tcp/80 56 KB/s 2 MB
3 ewe-ol-GGC-Node1-host8-167.cache.google.com tcp/80 0 B/s 20 MB
4 ewe-ol-GGC-Node2-241.cache.google.com tcp/443 0 B/s 354 KB
5 ewe-ol-GGC-Node2-241.cache.google.com tcp/80 0 B/s 29 KB 

Even if you enable the webproxy with only one network, for example Cisco VPN Pool (which is not configuried and without user), traffic doesnt stopp!
If you block this traffic in the Flow Controll Monitor (Sophos UTM defined it as "Google"), the traffic doesnt stopp.
When you lock in the web proxy log, the traffic isnt shown there, only th normal web traffic of the users.
Only application control is countig this traffic, but not able to stop it with a application control rule.
Sophos UTM show beetween 400-800 Concurrent connections, even when nobody is surfing,
If you disable the web proxy, only 30-50 connections are displayed, what i think is normal.

Everything else is normal and works fine.

Does anyone have an idea what is going on?

Thx for help!


This thread was automatically locked due to age.
  • To see what this traffic is, you can go to 'Logging & Reporting >> Network Usage' and, on the 'Bandwidth Usage' tab, run a report on "Top Services by Server" for each of those IPs 80.228.65.x.

    Cheers - Bob
  • Thanks for that bob, I wasn't sure if the traffic would be in the reports since the OP was seeing the traffic in flow monitor only.
  • I don't think its astaro traffic. The easiest way would be to remove all cables (other than internet) from the UTM temporarily and connect via console and run iftop to see if there is any traffic generated.

    Or you can do the following

    1. Disable all firewall rules temporarily. (Screenshot1)
    I did, nothethings changes
    2. Remove everything from your allowed networks in web filtering and see if any traffic is generated. (Screenshot2)
    Web Filtering doesn't without a network, i added a unused networks or also diabled alle the interface of the used networks (WLAN and internal), but nothething changed
    3. If there is no traffic, then add one network at a time back in allowed networks and see when the traffic begins so you can narrow down the problem network.

    Only stops when i disable the web proxy.
    iftop is a good idea, are there some more tools like this?
  • To see what this traffic is, you can go to 'Logging & Reporting >> Network Usage' and, on the 'Bandwidth Usage' tab, run a report on "Top Services by Server" for each of those IPs 80.228.65.x.

    See the picture
    Thx for helping again!
  • When "the traffic" nearly is using 100% of the WAN line, iftops shows that (see picture)
  • Something new:
    Application Control, who is counting the traffic of the webproxy (the webproxy isn't couting it's own traffic) shows now only the message in the logfile:

    2013:07:28-08:06:56 astaro afcd[5402]: _afc_conn_get_age(): The timestamp of connection 0x00038EFC is in the future; correcting ...

    What does it mean?
  • Hmmm this has been interesting for me too... for weeks I have had a heap of "Google" traffic hitting the external WAN. At times its 100% utilisation. All I have done is create a QoS download throttle on a destination/source pair to keep it under control. This traffic has been chewing up to 8 gig a day, a problem when the my copper line is only 1.2 mbps (rural)! None of the traffic is routed internally, so no idea what is causing it.