Guest User!

You are not Sophos Staff.

This discussion has been locked.
You can no longer post new replies to this discussion. If you have a question you can start a new discussion

http traffic not coming through

Hi,

I have a very odd issue with my UTM.

I've noticed this issue before but it went away somehow coming back today:

from time to time (about every 30 Minutes) websurfing is not possible anymore for a few minutes (5-10). Whenever that happens I see a lot of bandwidth beeing used to download something from "sophos content filter framework" in the flow monitor.

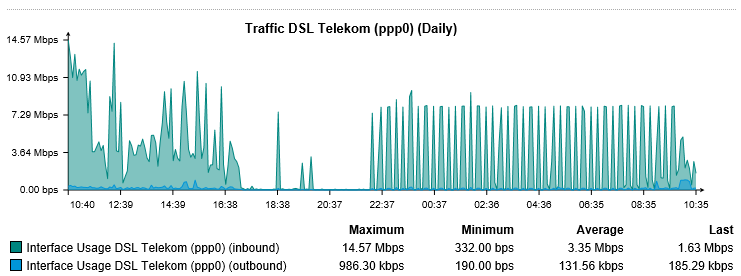
Until now it has already produced traffic of about 15 GB and I see this in my Network usage:


I have restarted the webproxy a few times now, changed the Content filter database to "mem", changed AV-Scanning to "single" and it seems gone.

Any ideas what caused this?

Cheers
Chris


This thread was automatically locked due to age.
  • What is your pattern update time set to? Its usually every 15 minutes.

    I have changed this to update every 2 hours
  • It's set to 1 hour. Hasn't been changed in the last year or so.
  • Also I believe it just eats up as much traffic as it gets in those situations. Since I have throttled downloading to 8 Mbps per connection it obviously doesn't go above that. It must be the UTM itself using the traffic because I have no corresponding outgoing traffic on any other interface.
  • What version are you running?
    what you are describing sounds like the content database downloading.

    Sounds like there is a change to either network or something similar that is causing the local database to reload eg download and install.

    Under v9.10x you don't need to install the local content database, you can use the function in EP.

    Ian
  • v9.105-9

    what kind of network change are you thinking of? Anything inside my perimeter?

    And what does "EP" stand for? Sorry I'm probably missing the obvious. I just used the ssh command to make it a local copy in memory and restartet the http proxy.
  • Hi,
    EP = end point protection. Each home user UTM comes with a 10 user Sophos EP licence for PC and MS servers along with management of the protected devices.

    What you could be looking for are short breaks on your link, something that doesn't cause a ADSL re-registration, but the UTM sees as link failure. Check what you have uplink monitoring is set to? I went through this for awhile until I changed what I was monitoring.

    Ian
  • Good idea, Ian.  Krycek,what do you see in the selfmonitoring and System Messages log files at the jump times?

    Cheers - Bob
  • Uplink monitoring is set to "automatic", so there are no customized entries. What is a best practice for this?

    Only entry in selfmonitoring for yesterday: 
    2013:08:29-01:35:52 pluto selfmonng[4705]: I check Failed increment ctasd_mem_usage counter 1 - 10
    
    2013:08:29-12:54:40 pluto selfmonng[4705]: I check Failed increment ctasd_mem_usage counter 1 - 10


    And here an exerpt of the system log:
    2013:08:29-07:50:01 pluto /usr/sbin/cron[10427]: (root) CMD (   /usr/local/bin/reporter/system-reporter.pl)
    
    2013:08:29-07:55:01 pluto /usr/sbin/cron[10707]: (root) CMD (   /usr/local/bin/reporter/system-reporter.pl)
    2013:08:29-08:00:01 pluto /usr/sbin/cron[11011]: (root) CMD (   /var/chroot-httpd/var/webadmin/extra/ash.plx)
    2013:08:29-08:00:01 pluto /usr/sbin/cron[11009]: (root) CMD (nice -n19 /usr/local/bin/create_rrd_graphs.plx)
    2013:08:29-08:00:01 pluto /usr/sbin/cron[11010]: (root) CMD (   /usr/local/bin/reporter/system-reporter.pl)
    2013:08:29-08:02:01 pluto /usr/sbin/cron[11816]: (root) CMD (  nice -n19 /usr/local/bin/gen_inline_reporting_data.plx)
    2013:08:29-08:05:01 pluto /usr/sbin/cron[12162]: (root) CMD (   /usr/local/bin/reporter/system-reporter.pl)
    2013:08:29-08:05:55 pluto daemon-watcher[4800]: Watching selfmonng.plx - running fine
    2013:08:29-08:10:01 pluto /usr/sbin/cron[12437]: (root) CMD (   /usr/local/bin/reporter/system-reporter.pl)
    2013:08:29-08:15:01 pluto /usr/sbin/cron[12742]: (root) CMD (nice -n19 /usr/local/bin/create_rrd_graphs.plx)
    2013:08:29-08:15:01 pluto /usr/sbin/cron[12743]: (root) CMD (   /usr/local/bin/reporter/system-reporter.pl)
    2013:08:29-08:17:01 pluto /usr/sbin/cron[13545]: (root) CMD (  nice -n19 /usr/local/bin/gen_inline_reporting_data.plx)
    2013:08:29-08:20:01 pluto /usr/sbin/cron[13904]: (root) CMD (   /usr/local/bin/reporter/system-reporter.pl)
    2013:08:29-08:23:01 pluto /usr/sbin/cron[14095]: (root) CMD (/sbin/audld.plx --nosys --trigger)
    2013:08:29-08:25:01 pluto /usr/sbin/cron[14211]: (root) CMD (   /usr/local/bin/reporter/system-reporter.pl)
    2013:08:29-08:25:51 pluto daemon-watcher[4800]: Watching selfmonng.plx - running fine
    2013:08:29-07:50:01 pluto /usr/sbin/cron[10427]: (root) CMD (   /usr/local/bin/reporter/system-reporter.pl)
    2013:08:29-07:55:01 pluto /usr/sbin/cron[10707]: (root) CMD (   /usr/local/bin/reporter/system-reporter.pl)
    2013:08:29-08:00:01 pluto /usr/sbin/cron[11011]: (root) CMD (   /var/chroot-httpd/var/webadmin/extra/ash.plx)
    2013:08:29-08:00:01 pluto /usr/sbin/cron[11009]: (root) CMD (nice -n19 /usr/local/bin/create_rrd_graphs.plx)
    2013:08:29-08:00:01 pluto /usr/sbin/cron[11010]: (root) CMD (   /usr/local/bin/reporter/system-reporter.pl)
    2013:08:29-08:02:01 pluto /usr/sbin/cron[11816]: (root) CMD (  nice -n19 /usr/local/bin/gen_inline_reporting_data.plx)
    2013:08:29-08:05:01 pluto /usr/sbin/cron[12162]: (root) CMD (   /usr/local/bin/reporter/system-reporter.pl)
    2013:08:29-08:05:55 pluto daemon-watcher[4800]: Watching selfmonng.plx - running fine
    2013:08:29-08:10:01 pluto /usr/sbin/cron[12437]: (root) CMD (   /usr/local/bin/reporter/system-reporter.pl)
    2013:08:29-08:15:01 pluto /usr/sbin/cron[12742]: (root) CMD (nice -n19 /usr/local/bin/create_rrd_graphs.plx)
    2013:08:29-08:15:01 pluto /usr/sbin/cron[12743]: (root) CMD (   /usr/local/bin/reporter/system-reporter.pl)
    2013:08:29-08:17:01 pluto /usr/sbin/cron[13545]: (root) CMD (  nice -n19 /usr/local/bin/gen_inline_reporting_data.plx)
    2013:08:29-08:20:01 pluto /usr/sbin/cron[13904]: (root) CMD (   /usr/local/bin/reporter/system-reporter.pl)
    2013:08:29-08:23:01 pluto /usr/sbin/cron[14095]: (root) CMD (/sbin/audld.plx --nosys --trigger)
    2013:08:29-08:25:01 pluto /usr/sbin/cron[14211]: (root) CMD (   /usr/local/bin/reporter/system-reporter.pl)
    2013:08:29-08:25:51 pluto daemon-watcher[4800]: Watching selfmonng.plx - running fine


    I don't read anything interesting from that...
  • Logic doesn't appear to be working in this case. The indications to me are that a configuration change is causing the local database to reload, but my hit rate in these forums is not great. Lets us try some diverse thinking.

    1/. how old is the utm hardware?
    2/. could you be having powersupply issues
    3/. how much memory does this utm have
    4/. check that all the chips, cables etc are seated correctly.
    5/. check all the cables external fully seated.

    Ian
  • Ian I appreciate your efforts [:)]

    1. about 3 years, it's an unused spare server machine we had left. Has been running fine as UTM for a year now.
    2. I doubt that. It has redundant power supplies and the monitoring doesn't show anything suspicious.
    3. 16 GB (usually about 25-30% in use)
    4. That can't be done so easily. Will keep it in mind though.
    5. did check that before, nothing visible really.

    Keep in mind that the problem is gone and hasn't come back up after I did all those things mentioned in the first post. I'm just looking for logical explanations because I have had this issue 3 times now in about 6 months for unidentified reasons and no obvious correlation to anything else.