This discussion has been locked.
You can no longer post new replies to this discussion. If you have a question you can start a new discussion

[9.0044-33] Spikes of High CPU and memory

Hi All

I am using v9.0044-33 with UTM 120 rev 5. I am also using disk as part of the htp_local_db

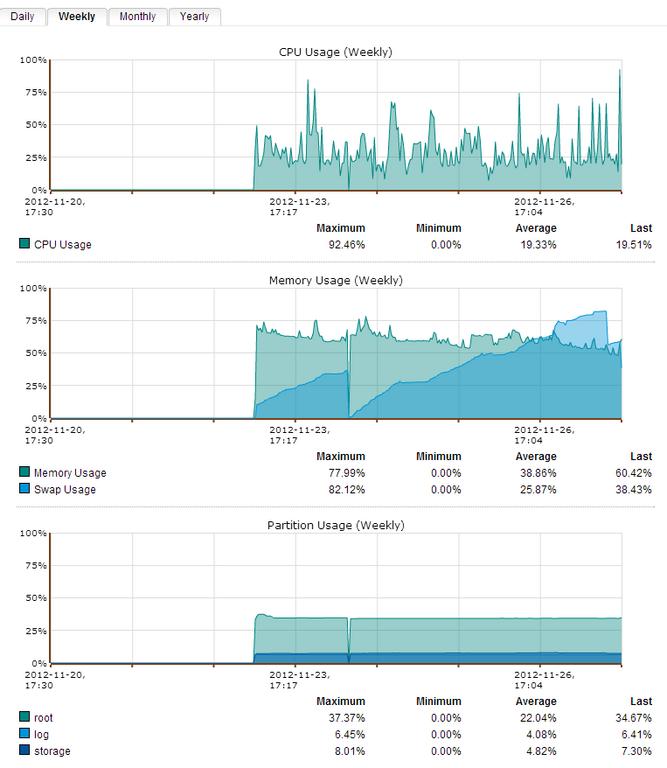
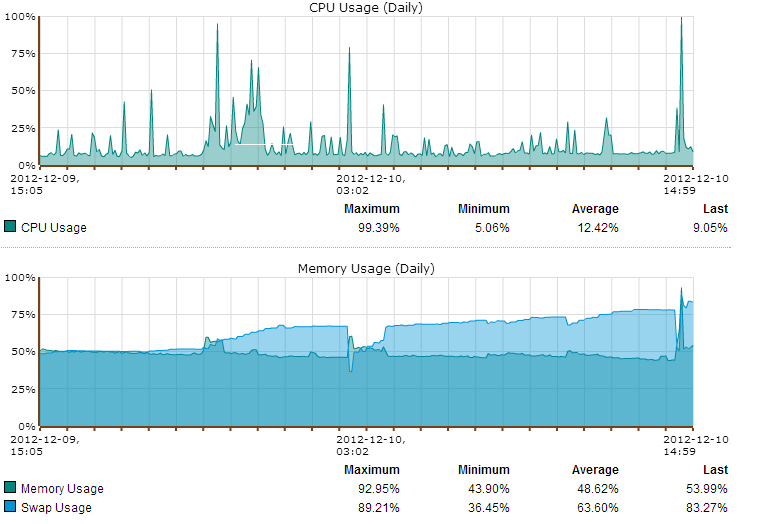
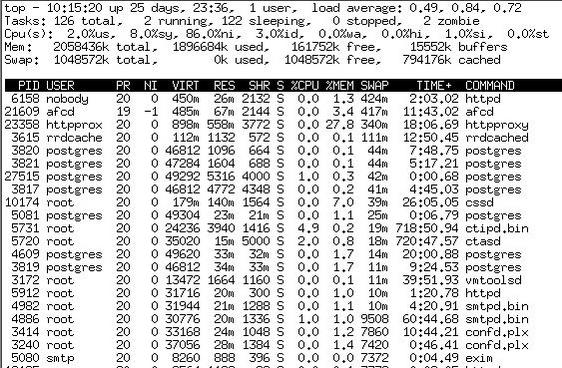
It seems that the box is spiking on cpu and the memory is high .I have attached the relevant pic

As part of the troubleshooting I used perf top
Results 
  
   PerfTop:    1403 irqs/sec  kernel:22.1%  exact:  0.0% [1000Hz cycles],  (all, 2 CPUs)
-------------------------------------------------------------------------------------------------------------------------------------

    58.13%  pngquant                [.] 0x558a
     4.60%  libz.so.1.2.3           [.] longest_match
     2.41%  libpng12.so.0.31.0      [.] 0xf93c
     2.21%  [kernel]                [k] read_hpet
     1.40%  [unknown]               [.] 0x8050ed3
     1.07%  libz.so.1.2.3           [.] deflate_slow
     0.97%  libc-2.11.3.so          [.] msort_with_tmp
     0.93%  libcairo.so.2.10800.8   [.] unpremultiply_data
     0.68%  perf                    [.] 0x1e000
     0.59%  libc-2.11.3.so          [.] memcpy
     0.58%  libexpat.so.1.5.2       [.] 0xf9e6
     0.56%  libz.so.1.2.3           [.] fill_window
     0.48%  libfontconfig.so.1.3.0  [.] .L110
     0.47%  ld-2.11.3.so            [.] do_lookup_x
     0.39%  libc-2.11.3.so          [.] _int_malloc
     0.36%  ntpd                    [.] 0x1d013
     0.36%  libfreetype.so.6.3.18   [.] TT_RunIns
     0.33%  libfreetype.so.6.3.18   [.] 0x17a25
     0.33%  libfontconfig.so.1.3.0  [.] FcCompareFamily
     0.32%  libasapsdk.so           [.] 0x20c35
     0.29%  libc-2.11.3.so          [.] strstr
     0.27%  libz.so.1.2.3           [.] adler32
     0.24%  libperl.so              [.] 0x101f1f
     0.22%  libc-2.11.3.so          [.] __i686.get_pc_thunk.bx
     0.21%  postgres                [.] 0x2b7d4c
     0.20%  libpixman-1.so.0.16.0   [.] pixman_rasterize_edges
     0.20%  libc-2.11.3.so          [.] malloc
     0.20%  libc-2.11.3.so          [.] strcmp
     0.19%  [kernel]                [k] __kmalloc
     0.19%  libc-2.11.3.so          [.] __memset_ia32
     0.18%  libz.so.1.2.3           [.] inflate_fast
     0.18%  [kernel]                [k] unmap_vmas
     0.17%  [vdso]                  [.] 0x55576431
     0.16%  [kernel]                [k] __schedule
     0.16%  [kernel]                [k] page_fault
     0.16%  [kernel]                [k] ia32_sysenter_target
     0.16%  libpthread.so.0         [.] 0xefbf
     0.15%  [kernel]                [k] timerqueue_add
     0.14%  libc-2.11.3.so          [.] _int_free
     0.14%  libpixman-1.so.0.16.0   [.] pixman_edge_init
     0.14%  [kernel]                [k] _raw_spin_lock
     0.14%  [kernel]                [k] hpet_legacy_next_event
     0.14%  libc-2.11.3.so          [.] free


what is that process and why it's inroducing spikes to the box?

/root # top -b -n 1 | head -n 12  | tail -n 5
13298 root      39  19  3640 2080  632 R     90  0.1   0:00.73 pngquant
 3729 root      20   0 11528 4788 1772 S     12  0.2  91:02.42 selfmonng.plx
 4162 root      20   0 10140 6212 1668 S      9  0.3  23:28.03 dns-resolver.pl
13299 root      20   0  2808 1212  804 R      9  0.1   0:00.07 top
 4686 root      20   0 32940  11m 3028 S      4  0.6 163:57.32 ctasd


Memory is normal at the moment: 

/root # ps auxf | sort -nr -k 4 | head -5
810      28489  1.0 18.9 1205400 387520 ?      Ssl  12:18   3:07 /var/chroot-http/usr/bin/httpproxy -f -c /var/chroot-http -u httpproxy
root      4324  1.8 12.3 339384 253364 ?       Ssl  16:27   0:58 /usr/bin/cssd -d
snort     5520  0.3  5.5 385324 113612 ?       S


Most of the swap is allocated to the HTTP proxy (Run top then press 'O' (capital letter o) followed by 'p' then 'enter'. Now processes should be sorted by their swap usage.)

top - 17:22:28 up 3 days,  8:16,  1 user,  load average: 0.67, 1.22, 1.30
Tasks: 344 total,   1 running, 341 sleeping,   0 stopped,   2 zombie
Cpu(s):  2.4%us,  2.7%sy,  0.0%ni, 94.6%id,  0.3%wa,  0.0%hi,  0.0%si,  0.0%st
Mem:   2048484k total,  1666536k used,   381948k free,     3732k buffers
Swap:  1048572k total,   401552k used,   647020k free,   606832k cached

  PID USER      PR  NI  VIRT  RES  SHR S   %CPU %MEM    TIME+  SWAP COMMAND
28489 httpprox  20   0 1177m 377m 1312 S      0 18.9   0:36.18 799m httpproxy
28490 httpprox  20   0 1177m 377m 1312 S      0 18.9   0:07.72 799m httpproxy
28491 httpprox  20   0 1177m 377m 1312 S      0 18.9   0:00.74 799m httpproxy
28505 httpprox  20   0 1177m 377m 1312 S      0 18.9   0:00.14 799m httpproxy
28508 httpprox  20   0 1177m 377m 1312 S      0 18.9   0:00.75 799m httpproxy
28509 httpprox  20   0 1177m 377m 1312 S      0 18.9   0:00.83 799m httpproxy
28510 httpprox  20   0 1177m 377m 1312 S      0 18.9   0:00.50 799m httpproxy

28511 httpprox  20   0 1177m 377m 1312 S      0 18.9   0:00.47 799m httpproxy
28512 httpprox  20   0 1177m 377m 1312 S      0 18.9   0:00.43 799m httpproxy
28513 httpprox  20   0 1177m 377m 1312 S      0 18.9   0:00.43 799m httpproxy
28514 httpprox  20   0 1177m 377m 1312 S      0 18.9   0:00.41 799m httpproxy
28515 httpprox  20   0 1177m 377m 1312 S      0 18.9   0:00.45 799m httpproxy


There are  too many child-processes for httpproxy is this normal?


This thread was automatically locked due to age.
  • 4 gigs of ram works well.given sophos public opinion that swap is ok it will be interesting to see if they clean up the code(not sure how that can be done with the huge featureset) or if they finally step into reality and start pushing out boxes with 4 gigs to start and go up from there.

    Owner:  Emmanuel Technology Consulting

    http://etc-md.com

    Former Sophos SG(Astaro) advocate/researcher/Silver Partner

    PfSense w/Suricata, ntopng, 

    Other addons to follow

  • disabling the htps_db did the trick but the swap still goes up lke crazy because of the HTTP proxy. I am no sure why this is the case

    loginuser@****:/home/login > vmstat -S M
    procs -----------memory---------- ---swap-- -----io---- -system-- -----cpu------
     r  b   swpd   free   buff  cache   si   so    bi    bo   in   cs us sy id wa st
     0  0    892    862      3    349    0    0    46    26   38    2 17  5 77  2  0 


    top - 15:08:33 up 4 days,  2:08,  1 user,  load average: 0.90, 1.24, 1.65
    Tasks: 157 total,   1 running, 154 sleeping,   0 stopped,   2 zombie
    Cpu(s):  2.8%us,  3.5%sy,  0.0%ni, 93.1%id,  0.5%wa,  0.0%hi,  0.2%si,  0.0%st
    Mem:   2048484k total,  1178296k used,   870188k free,     5088k buffers
    Swap:  1048572k total,   912544k used,   136028k free,   415508k cached

      PID USER      PR  NI  VIRT  RES  SHR S   %CPU %MEM    TIME+  SWAP COMMAND
     6760 httpprox  20   0 1272m 172m  264 S      0  8.6  44:20.96 1.1g httpproxy
     4726 afcd      19  -1  486m 7156 1980 S      0  0.3  11:07.78 479m afcd
    18878 snort     19  -1  454m  36m 9080 S      3  1.8  60:25.06 417m snort_inline
    18273 root      20   0  331m 151m  564 S      0  7.6   0:40.59 180m cssd
     3438 rrdcache  20   0  131m  512  368 S      0  0.0   4:46.25 130m rrdcached


      PID USER      PR  VIRT  NI  RES  SHR S   %CPU %MEM    TIME+  SWAP COMMAND
     6760 httpprox  20 1272m   0 153m 1724 S      0  7.7   0:42.00 1.1g httpproxy
     6761 httpprox  20 1272m   0 153m 1724 S      0  7.7   1:35.88 1.1g httpproxy
     6762 httpprox  20 1272m   0 153m 1724 S      0  7.7   0:09.69 1.1g httpproxy
     6772 httpprox  20 1272m   0 153m 1724 S      0  7.7   0:02.32 1.1g httpproxy
     6777 httpprox  20 1272m   0 153m 1724 S      0  7.7   0:45.07 1.1g httpproxy
     6778 httpprox  20 1272m   0 153m 1724 S      0  7.7   0:48.15 1.1g httpproxy
     6779 httpprox  20 1272m   0 153m 1724 S      0  7.7   0:59.85 1.1g httpproxy
     6780 httpprox  20 1272m   0 153m 1724 S      0  7.7   1:09.99 1.1g httpproxy
     6781 httpprox  20 1272m   0 153m 1724 S      0  7.7   0:20.64 1.1g httpproxy
     6782 httpprox  20 1272m   0 153m 1724 S      0  7.7   0:15.31 1.1g httpproxy
     6783 httpprox  20 1272m   0 153m 1724 S      0  7.7   0:19.52 1.1g httpproxy
     6784 httpprox  20 1272m   0 153m 1724 S      0  7.7   0:13.54 1.1g httpproxy
     6785 httpprox  20 1272m   0 153m 1724 S      0  7.7   0:14.03 1.1g httpproxy
     6786 httpprox  20 1272m   0 153m 1724 S      0  7.7   0:23.36 1.1g httpproxy
     6787 httpprox  20 1272m   0 153m 1724 S      0  7.7   0:41.68 1.1g httpproxy
     6788 httpprox  20 1272m   0 153m 1724 S      0  7.7   0:33.99 1.1g httpproxy
     6789 httpprox  20 1272m   0 153m 1724 S      0  7.7   0:13.50 1.1g httpproxy


    *****:/root # cc get http sc_local_db
    none


    Why is the http proxy using 1.1G of swap ?
  • Hi Wingman,
    Do you have the proxy set to do caching?
     (I'm not talking about the local content filter option).

    Barry
  • Hi Wingman,
    Do you have the proxy set to do caching?
    (I'm not talking about the local content filter option).

    Barry


    Yes Barry I do (no SSL content and  no content that contains cookies selected ). The swap was 99.9 so clearing the cache brought the Swap down to 67.84%

    THanks
  • Try and see if disabling the caching helps with the memory leak?

    Barry
  • Try and see if disabling the caching helps with the memory leak?

    Barry


    nope it doesn't

    Owner:  Emmanuel Technology Consulting

    http://etc-md.com

    Former Sophos SG(Astaro) advocate/researcher/Silver Partner

    PfSense w/Suricata, ntopng, 

    Other addons to follow

  • The CPU is still high as per attached. I have cleared and disabled the caching.Let's see

    The swap dropped from 76% to 66% once performed the actions above

    Swap output from TOP

      PID USER      PR  NI  VIRT  RES  SHR S   %CPU %MEM    TIME+  SWAP COMMAND
     9996 httpprox  20   0 1268m 316m 8072 S      0 15.8   0:41.02 951m httpproxy
     4726 afcd      19  -1  486m 9600 2044 S      0  0.5  17:52.33 476m afcd
    18878 snort     19  -1  452m  38m 9136 S      3  1.9 126:59.80 413m snort_inline
     3438 rrdcache  20   0  131m  564  304 S      0  0.0   7:01.87 130m rrdcached
    30606 root      20   0  343m 281m  660 S      0 14.1   0:38.07  61m cssd
     3679 root      20   0 80948  28m 1396 R    101  1.4 125:30.84  50m mdw.plx
    24947 postgres  20   0 49308 1160 1004 S      0  0.1   0:00.18  47m postgres
    18796 root      20   0 47088  220   28 S      0  0.0   0:00.53  45m confd.plx
     9587 postgres  20   0 46816  296  204 S      0  0.0   0:55.38  45m postgres
     9588 postgres  20   0 47088  756  372 S      0  0.0   0:20.81  45m postgres
     3602 postgres  20   0 46816 1036  912 S      0  0.1   0:50.11  44m postgres
     9640 postgres  20   0 49236 3616 3044 S      0  0.2   0:00.16  44m postgres


    It's definitely better than before but it still high
  • My proxy is not swapping that excessively even with the local content db enabled. Try manually restarting the proxy
    /var/mdw/scripts/httpproxy restart
    

    I have noticed that the memory usage specially virtual memory changes dramatically with a command line restart of the proxy compared to webadmin start. I even brought it up once for astaro but nobody paid any attention [8-)]

    Also, disk caching on the proxy is useless in my opinion. I loved disk caching when squid was being used as you could change the config file and optimize it. With all the other things constantly hammering the disk, in my opinion disk caching just drags the system and spikes the wait time and cpu unnecessarily.

    Maybe a rebuild of your appliance is in order. Sometimes it just doesn't bake right for some reason[:D]


    What do you mean by webadmin proxy restart?

    ps. I am restarting my UTM 9.004-33 every week because swap gets 100% and internet just stops responding. Also caching is turned off.
    will try command line restart only for proxy /var/mdw/scripts/httpproxy restart